

Ever squinted at a box score like it’s the Voynich Manuscript of sports? You’re not alone. These grids of numbers, born from Henry Chadwick’s 1859 scoring system, are more than stats. They are fossil records of America’s cultural DNA.
Chadwick, a Victorian-era journalist, didn’t just invent the box score. He built a statistical framework that turned beer-soaked ballpark chaos into quantifiable poetry.
Picture Civil War-era scribes arguing over whether a fielder’s error should count as a hit. That’s where sabermetrics history begins – not with Billy Beane’s spreadsheets, but with ink-stained scorecards that sparked baseball’s first analytics war. The box score became a time machine, preserving everything from Babe Ruth’s swing to Jackie Robinson’s stolen bases.
Modern Moneyball acolytes might think they invented data-driven fandom. But flip through any of the great baseball analytics books, and you’ll find Chadwick’s ghost whispering: “I was quantifying RBIs before your great-grandpa chewed tobacco at Ebbets Field.” Today’s OPS+ and WAR metrics? Just jazz solos on Chadwick’s original score.
So grab your metaphorical magnifying glass. We’re decoding these numerical hieroglyphs to reveal how a .220 batting average once caused congressional hearings – and why your fantasy league obsession is basically Hamilton with more pine tar.
Early Origins of Box Scores
Imagine 19th-century sportswriters fighting over batting averages like today’s fans arguing on Reddit. The 1870s were America’s first baseball language war. It was a battle between stats-focused writers and showy promoters that shaped our game today.
Two key manuals ruled this early era: Beadle’s Dime Base Ball Player and DeWitt’s Base Ball Guide. Henry Chadwick’s Beadle series was like a Moneyball guide, focusing on scorekeeping details. On the other hand, DeWitt guides, backed by Albert Spalding, focused on exciting stories over stats. It was like ESPN vs. FanGraphs, but with more mustaches.
| Year | Publisher | Focus | Legacy |
|---|---|---|---|
| 1871 | Beadle | Statistical rigor | Invented ERA calculation |
| 1874 | DeWitt | Player biographies | Pioneered box score storytelling |
| 1876 | Both | Standardization battles | Created modern game reporting templates |
Chadwick’s team saw baseball as a math problem to solve. Their score sheets looked like Civil War maps, tracking every play. Spalding’s group, on the other hand, sold tickets and promoted his sports goods.
The debate today over WAR stats echoes these old fights. When a 1876 writer criticized Chadwick’s stats, he was basically tweeting about the MVP. The debate between stats and stories, numbers and myths, was already forming in the 19th century.
Key Components Explained

Why did 19th-century scorekeepers give errors the same weight as hits? Let’s dive into an 1892 Cy Young box score like it’s ancient history. Imagine a time when “SH” meant “shoulder height,” not sacrifice hit. And pitchers were judged by complete games, not their spin.
Three things make a box score expert:
- The Error Epidemic: Errors were listed above hits in old scorecards. It was like a trophy for bad defense.
- Mystery Abbreviations: “TP” meant triple play, not toilet paper. Some teams were bad enough to need both.
- Range Factor’s Faceplant: This 1873 metric tried to measure defense but failed. It was too complex.
Look at Young’s 1892 stats: 9 IP, 12 H, 1 BB, 3 K. Today, it looks average. But to historians, it’s a big deal. It marks the start of the strikeout era. That’s stats literacy – seeing the story behind the numbers.
Then there’s the 1869 game between Cincinnati and New York. It was like a baseball showdown with a nuclear option. The score was 209-10 Cincinnati. The box score needed footnotes to explain why outfielders had “-17 putouts.” It was like a math puzzle with a story.
What to Look For: Player and Game Trends
Box scores are like time machines. They show us the past, like a 19th-century pitching disaster or a modern bullpen’s power. To spot trends, look for the Moneyball impact in today’s stats. High spin rates and launch angles are today’s versions of old scandals.
Deadball Era box scores are like mystery novels. A .220 batting average in 1910 was rare. Today, a .220 hitter might get cut quickly. The real magic is in comparing these numbers with player development trends:
| Era | Hidden Trend | Modern Parallel |
|---|---|---|
| Deadball (1900-1919) | Complete games = durability | Pitch clock adaptation rates |
| Live Ball (1920+) | HR spikes signaling swing changes | Launch angle optimization |
| Moneyball (2002+) | OBP over batting average | AI-driven defensive shifts |
Scouting the minors? AAA box scores are like reality TV auditions. A 22-year-old with a 14.3 K/9 rate in Double-A could be the next big thing or a trade bait. Player development books like “The MVP Machine” show the secret to success: look for pitchers adding new pitches or hitters walking more.
Pro tip: When analyzing minors and player advancement, ignore the ERA. Look for:
- Strikeout-to-walk ratios improving monthly
- Ground ball rates dropping fast
- Pitch velocity jumps that defy aging curves
Remember, today’s minor league stat could be tomorrow’s Moneyball breakthrough. Box scores never lie, but they sometimes need creative interpretation.
Historic Box Scores of Note
Baseball’s old scorecards tell tales as wild as a bartender’s stories. They’re not just numbers; they’re pieces of history that show how baseball reflects society. Let’s look at three games where stats became legends.
The 1869 Cincinnati Red Stockings didn’t just win 57 games; they shattered records. Henry Chadwick’s early stats showed a team so unbeatable, their .862 batting average would shock today’s analysts. Their games were like industrial feats, with 428 runs scored and only 162 allowed.
By June 4, 1892, the game was a bit of a mess. There were 37 errors and 23 hits. It wasn’t bad play; it was a sign of the times. With no gloves and dim lighting, games were more like slapstick shows. The E column in the scorecard? It was like a symbol of the Gilded Age’s chaos.
| Year | Game | Cultural Impact | Statistical Oddity |
|---|---|---|---|
| 1869 | Cincinnati Red Stockings | First professional team | .862 team batting average |
| 1892 | Unnamed “Error Fest” | Exposed pre-modern equipment issues | 1.6 errors per inning |
| 1871 | Izee Wright Mystery | Early example of roster fraud | 0 ABs for “phantom” player |
In 1871, the Izee Wright scandal shook the league. A player named Izee was listed, but he didn’t exist. When asked to meet him, his teammates said he’d died… twice. It was a case of baseball’s early-day hustle and fake news.
Why do we care about these old scores? They’re like time machines. The Red Stockings’ stats show America’s industrial growth. The 1892 game foreshadows labor issues. And Izee Wright? He’s the first fake news story in baseball history. Each scorecard is a treasure trove of truth.
Evolution and Digital Presentation
Imagine Babe Ruth’s 1927 season with an “algorithmic umpire”. The box score revolution started with ink and math debates in the 19th century. Today, we have augmented reality, making smartphone updates seem simple.
The 1870s were filled with data wars over scoring. Henry Chadwick’s early stats faced off against traditionalists. It was like today’s “juiced ball” debates, but more intense. Then, baseball used microfilm as its first cloud storage, a heavy, mothball-smelling cloud.
Now, we’re like diamond detectives, solving mysteries with baseball analytics. We can redo Cap Anson’s 1880s ERA calculations. Statcast’s laser tracking is just the latest step in tracking every detail of the game.
When old and new meet, magic happens. Machine learning uncovers patterns in old scorebooks. Next time you see a WAR stat, think of the Victorian statisticians who paved the way.
Resources for Practicing
To build your box score bunker, you need three things. First, get a scorebook older than your great-grandfather’s mustache. Next, learn about the history of baseball uniforms. And last, be determined to understand Chadwick’s cursive. We’ll help you get ready.
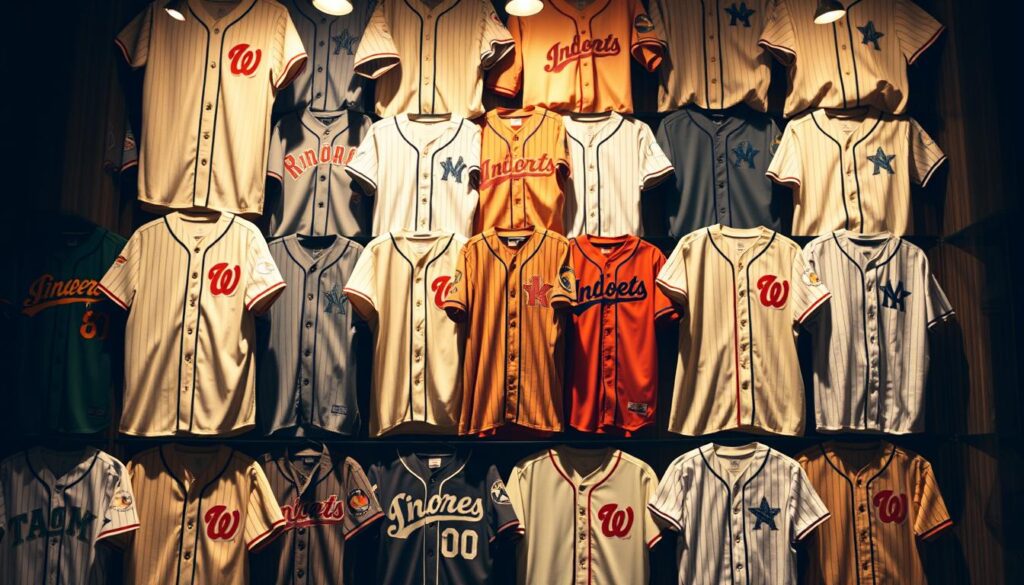
Start by digging through old archives. Henry Chadwick’s 1881 Manual of Baseball is like a mystery novel for stats lovers. It explains why baseball’s history needed standard scoring. Pair it with “The Hidden Game of Baseball” for a modern stats perspective.
For more, check out “Knickerbocker Rules & Ragtag Uniforms”. It shows how bad eyesight and wool jerseys almost led to a scoring disaster.
Here are some must-reads for your collection:
- “Baseball’s Paper Trail” (1890-1910 scoring ledgers analyzed like Dead Sea Scrolls)
- “Numbers Don’t Lie, But Your Eyes Might” (how uniform colors impacted error tracking)
- “From Slide Rules to Sabermetrics” (math meets mythology)
Pro tip: Treat player development books like cheat codes. The 1925 “Science of Swing Timing” reveals why early box scores missed strikeout types. It was due to ink shortages and too many players named “Stumpy”.
Having trouble? Try scoring a 1909 game with 1870s “vision-correcting” glasses. It’s like trying to see through a fog. Then, modern analytics apps will seem like lifesavers.
Classic Literature Excerpts
If you think Moneyball started baseball analytics, meet the 19th-century writers. They turned box scores into deep thoughts. Their writings about “hippodroming” (game-fixing) are like today’s Twitter fights but more serious.
In 1875, the Chicago Tribune wrote: “The shameless theatrics displayed yesterday would embarrass a traveling circus troupe. When will these ‘gentleman athletes’ learn that baseball is not a vaudeville act?” This wasn’t just about bad plays. It was about starting sabermetrics history by measuring cheating.
Henry Chadwick, the early stats pioneer, once complained about “rubber-core balls that turn honest flyouts into cheap homers.” His 1874 rant predicted the importance of launch angle with uncanny accuracy:
- “The very soul of fair play lies in predictable sphere trajectories”
- “A ball should neither bounce like India rubber nor die like a wounded duck”
These writers didn’t just report games; they curated them. A typical 1870s recap might spend three paragraphs on a pitcher’s mustache wax before the score. But in that baseball language, you find the roots of today’s analytics:
• Probability calculations hidden in moral outrage
• Defensive shifts explained through Shakespearean metaphors
• WAR-like player valuations hidden in snarky asides
Want to explore this linguistic treasure? Look for these forgotten gems:
- “The Great Hippodrome Hoax of ’78” (New York Clipper)
- Chadwick’s “On Elastic Balls and Moral Elasticity” pamphlet
- Any 1870s Boston Globe coverage with “scientific base-ball”
Reading these today is like finding your great-grandfather’s secret account. The sabermetrics history we celebrate today? They were debating it with quills and whiskey. Now, I need to get some fountain pen ink and 19th-century anger.
Conclusion
Learning to read baseball box scores is like traveling through time with a calculator. The cryptic abbreviations and decimal points unlock moments like Merkle’s Boner in 1908 and DiMaggio’s 56-game hitting streak in 1941. These stats are more than numbers; they’re stories of baseball’s history.
Imagine Ted Williams’ .394 batting average as a Shakespearean drama. Rickey Henderson’s 1,406 stolen bases are like a performance art piece. Spotting patterns in box scores reveals the evolution of baseball, from the 1927 season’s smell of bourbon to today’s analytics.
Want to show off? Learn about the 1869 Cincinnati Red Stockings’ 209-run game. It’s a glimpse into baseball’s early days. Today’s fans can appreciate the history behind each run.
When you look at MLB’s Gameday or old Sporting News, you’re doing more than reading stats. You’re exploring Babe Ruth’s records and Satchel Paige’s stories. It’s like analyzing the Zapruder film. So, grab your pencil or phone and dive into tonight’s box score.