
MLB infrastructure investment is best read as a long shift in how clubs, cities, and public agencies defined the value of a ballpark. The stadium stopped being only a place to stage 81 regular-season home games. In the cases supplied by the historical record, it became a design statement, a financing problem, a real estate anchor, and a public-policy test.
That does not mean every stadium project produced the same return. The evidence points in different directions depending on location, cost sharing, surrounding development, and the time horizon used to measure results. As Tyler Rhodes, I view these cases less as a single success formula than as a set of choices that shaped baseball’s business structure and the relationship between teams and host cities.
MLB infrastructure investment After Camden Yards
Why MLB infrastructure investment Shifted Downtown
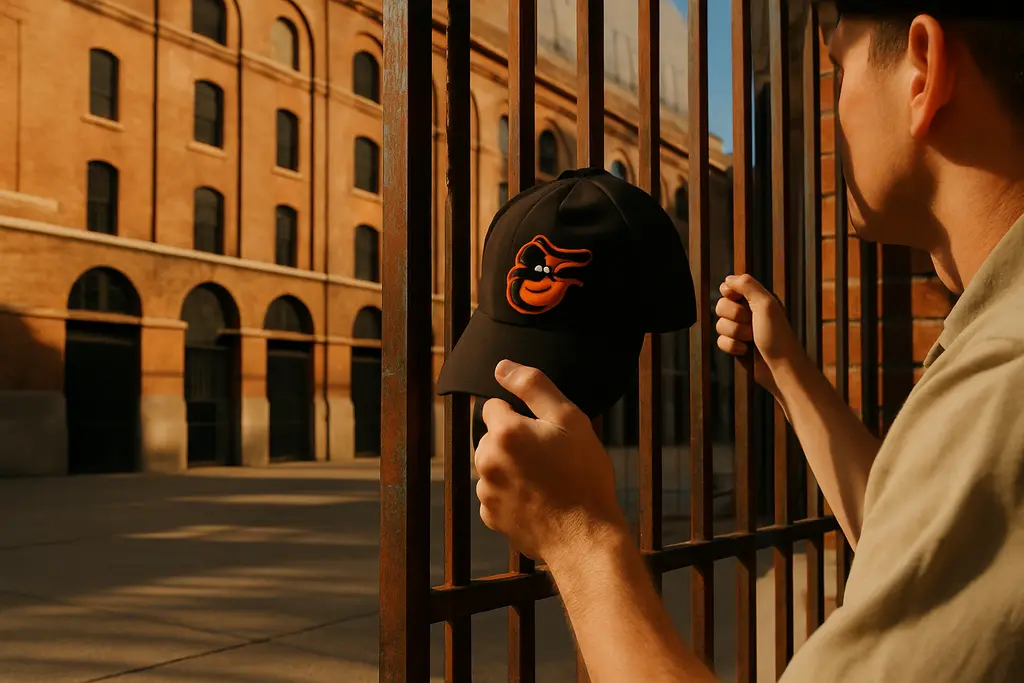
Oriole Park at Camden Yards opened in Baltimore on April 6, 1992. Its importance in stadium history rests on more than its debut date. The park helped fuel a wave of downtown, retro-style MLB ballparks that replaced multipurpose stadiums. It offered a design model built around urban setting and spectator experience, rather than a generic concrete bowl used by several sports. MLB’s account of the Orioles’ 25-year celebration treated Camden Yards as a defining point in modern ballpark design Camden Yards anniversary.
The strategic lesson is clear but limited. Camden Yards showed that venue design could become part of a club’s identity. It also showed that location mattered. A downtown ballpark could connect the sport to streets, buildings, transit patterns, and pregame habits in ways an isolated multipurpose venue often could not. That does not prove every downtown stadium creates the same civic return. It does show why later teams and cities treated ballpark placement as an investment decision, not only a construction choice.
PETCO Park And Redevelopment Claims
The San Diego Padres and the City of San Diego developed PETCO Park across a long project window from 1994 to 2007. The total project cost was $474 million, with the city paying $301 million. By 2007, three years after the park opened, redevelopment in the formerly blighted downtown area had triggered about $4.25 billion in projects, with roughly $4.0 billion of that amount private, according to the Stanford Graduate School of Business case on PETCO Park redevelopment.
PETCO Park is often used as a stronger redevelopment case because the post-opening private investment figure was so large compared with the ballpark cost. Even so, the historical reading should stay careful. The case supports the claim that the stadium was tied to a major redevelopment program. It does not, by itself, settle how much of that activity would have occurred without the ballpark, or how benefits were distributed across taxpayers, property owners, fans, and the franchise. In stadium analysis, timing and attribution are two different questions.
Financing Models And Public Exposure
Private Capital And Public Risk
Financing structure is one of the clearest lines separating ballpark projects. The cases in the research record show a wide range of public and private exposure. Busch Stadium in St. Louis opened on April 4, 2006, with a construction cost of $365 million. Nearly 90% of the capital cost was covered by the Cardinals through private funds, while public contributions were limited to supporting infrastructure and admissions tax relief.
Miller Park in Milwaukee, which opened on March 1, 2000, followed a different ownership and cost structure. The listed stadium cost was $322 million, split between $250 million for the stadium and $72 million for surrounding infrastructure. The Southeast Wisconsin Professional Baseball Park District held 64% ownership, while the Brewers held 36%. Yankee Stadium, opened in 2009, represented another model: a roughly $2.3 billion project financed through PILOT bonds, with the Yankees contributing about $670 million toward construction and city and state involvement tied to about $1.7 billion in bond financing.
| Project | Opening Date | Cost And Structure | Investment Lesson |
|---|---|---|---|
| Busch Stadium | April 4, 2006 | $365 million; nearly 90% private capital from the Cardinals | Lower direct public capital exposure can change the political risk profile. |
| Miller Park | March 1, 2000 | $322 million; district 64% ownership and Brewers 36% | Shared ownership can tie a club to a regional public authority. |
| Yankee Stadium | 2009 | About $2.3 billion; PILOT bonds and a Yankees contribution near $670 million | Bond structures can stretch public finance questions across many years. |
Subsidies And Long Time Horizons
The research record also includes a broader estimate that governments have spent about $50 billion since the mid-20th century to subsidize facilities for major-league teams in the United States, with that amount projected to double by the end of the 2030s if current trends continue. That figure is not limited to baseball, but it helps frame why MLB infrastructure investment remains a public issue as well as a team issue.
The central concern is not simply whether a new venue is attractive or whether fans prefer better concourses and sightlines. The larger question is who carries risk if promised returns take longer than expected or arrive in forms that are hard to measure. Sales taxes, admissions tax relief, land assembly, bond financing, and infrastructure support can all make a deal work, but each shifts some part of the cost away from the scoreboard and into public finance.
Mixed-Use Districts As Team Strategy

Real Estate Revenue Beyond Gates
The Atlanta Braves’ move to Truist Park and the adjacent Battery Atlanta development marked a later stage in the strategy. Truist Park opened in 2017, and The Battery became a major revenue source beyond ticket sales. In the first half of the 2025 season, The Battery generated $25.1 million, up 49% year over year, largely driven by rental income. The Braves also acquired the six-building Pennant Park office complex in April 2025.
For fiscal 2024, Braves Holdings Inc. reported total revenue of about $663 million. The mixed-use development accounted for roughly $71 million of that total, with much of the revenue tied to rentals and parking. By 2025, The Battery area consisted of 60 parcels generating $8.74 million in tax revenue, more than Cobb County’s annual debt service obligation for the stadium project. Those figures make the Braves case central to any analysis of ballparks as real estate platforms.
What Teams Learned From The Battery Model
The Battery example matters because it shifted the investment discussion from game-day spending to year-round cash flow. A club with adjacent office, retail, parking, and rental income is not depending only on ticket sales, concessions, local media, or postseason appearances. That does not remove baseball risk from the model. It changes the balance of revenue sources tied to the franchise and its controlled environment.
This topic also connects with broader sports venue analysis across the same network at Scar Sports, where stadium projects can be compared with infrastructure decisions in other sports. Baseball, however, has its own rhythm. A large home schedule gives teams more dates to activate a district, while the sport’s long calendar can make nearby development more attractive than it would be for a venue used less often.
- Mixed-use development can create revenue that is not limited to ticket demand.
- Higher private capital participation can reduce direct taxpayer exposure.
- Public financing tools can spread costs across long periods.
- Redevelopment claims require caution because timing does not always prove causation.
MLB infrastructure investment Lessons
The historical cases point to a restrained set of lessons. Camden Yards showed the power of ballpark design and downtown placement. PETCO Park offered a documented case in which a stadium project was tied to large-scale private redevelopment. Busch Stadium illustrated a model with heavy private capital participation. Miller Park and Yankee Stadium showed how ownership structures and bond financing can shape public exposure. Truist Park and The Battery showed how a franchise could use adjacent real estate as part of its operating model.
The strongest conclusion is not that one structure always works. It is that MLB infrastructure investment has moved from stadium construction toward district strategy. The best-supported projects in the research record paired a venue with either strong design identity, significant private participation, or measurable nearby development. The weaker claims are the broad ones: promises that a ballpark alone will repair a local economy, or that public cost will be offset without careful attention to debt, tax revenue, and who receives the gains.